Most post-event reports show what happened. A good one shows what it was worth. Here’s the framework for building ROI reports that move budget conversations and keep sponsors coming back.

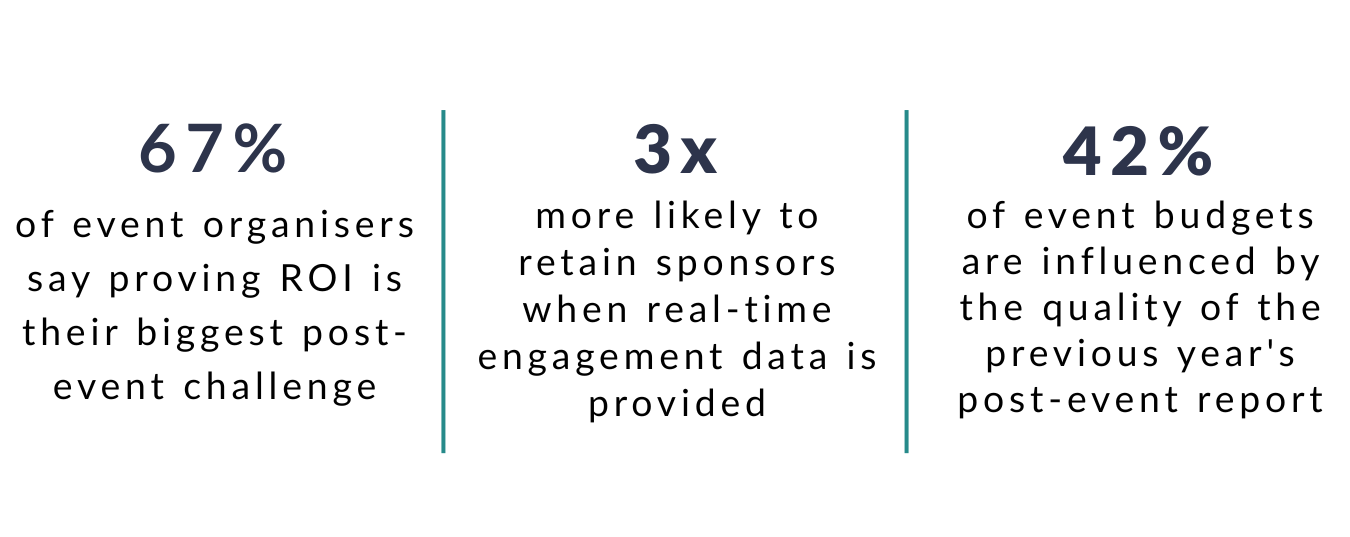
If you’ve ever tried to justify your event budget with a registration count and a few satisfaction scores, you already know the problem. The data exists, but it doesn’t tell a story, and it doesn’t make the case for next year’s spend. A good event ROI report does far more than summarise what happened. It connects your event to measurable business value and gives every stakeholder, from the CFO to the sponsoring brand, a reason to say yes again.
For event planners, PCOs, corporate event managers and agencies, post-event reporting is increasingly a strategic asset. The organisations that report well retain sponsors, protect budgets and build internal credibility. Those that don’t fight the same battles year after year.
This guide covers exactly what a good event ROI report should include, how to structure it for maximum impact, when to send it, and what separates a report that gets filed from one that shapes decisions. There is a practical checklist at the end you can use before sending your next one.
What metrics should be in an event ROI report?
A good event ROI report should cover four core dimensions: attendance and reach, attendee engagement, sponsor and exhibitor performance, and pipeline or business impact. Together, these metrics give stakeholders a complete picture of what the event delivered and why it mattered. Presenting only one or two dimensions is one of the most common reasons post-event reports fail to influence decisions.
The right balance between these dimensions depends on your event type. A corporate internal conference leans heavily on engagement and pipeline data. An association annual meeting prioritises membership metrics and sponsor ROI. A PCO managing a client event focuses on what the client cares about most. Before you build your event ROI report, be clear about what success looks like for your specific audience and state those objectives at the top of the document.
Attendance and reach
Attendance data sets the context for every other metric in your post-event report. The most useful figures are registered versus attended, no-show rate by ticket type or audience segment, session-level versus event-level attendance, and geographic or organisational spread. A 70% attendance rate at a 500-person conference tells a very different story from 70% at a 5,000-person event. If your target audience of senior decision-makers had a significantly lower show rate than general delegates, that is critical context for interpreting your engagement and pipeline data.

How do you measure attendee engagement at an event?
Attendee engagement at events is measured through event app usage, session check-in rates, poll and survey participation, networking activity and content interactions. Attendance tells you who was in the room. Engagement tells you whether they were present in it, and this distinction is what makes engagement data the most persuasive section of any event ROI report for modern stakeholders.
Engagement data comes from your event app, session scanning tools, live polling software and post-event surveys. The metrics to include are: app logins and active users throughout the event, session check-in rates broken down by session and track, poll and survey participation rates, networking interactions such as meetings booked and connections made, and content engagement including document downloads and resource clicks.
- App logins and active users during the event
- Session check-in rates: which sessions drew people in, which didn’t
- Poll and survey participation rates
- Networking interactions: meetings booked, connections made
- Content downloads or resource clicks
Post-event survey results also belong in this section. Net Promoter Score, satisfaction ratings, session feedback and speaker ratings all contribute to a rounded picture of attendee experience. Present survey data with context. A satisfaction score of 4.2 out of 5 means more when you note it is up from 3.8 the previous year, or above the industry average for your event format.
What does sponsor ROI reporting look like in 2026?
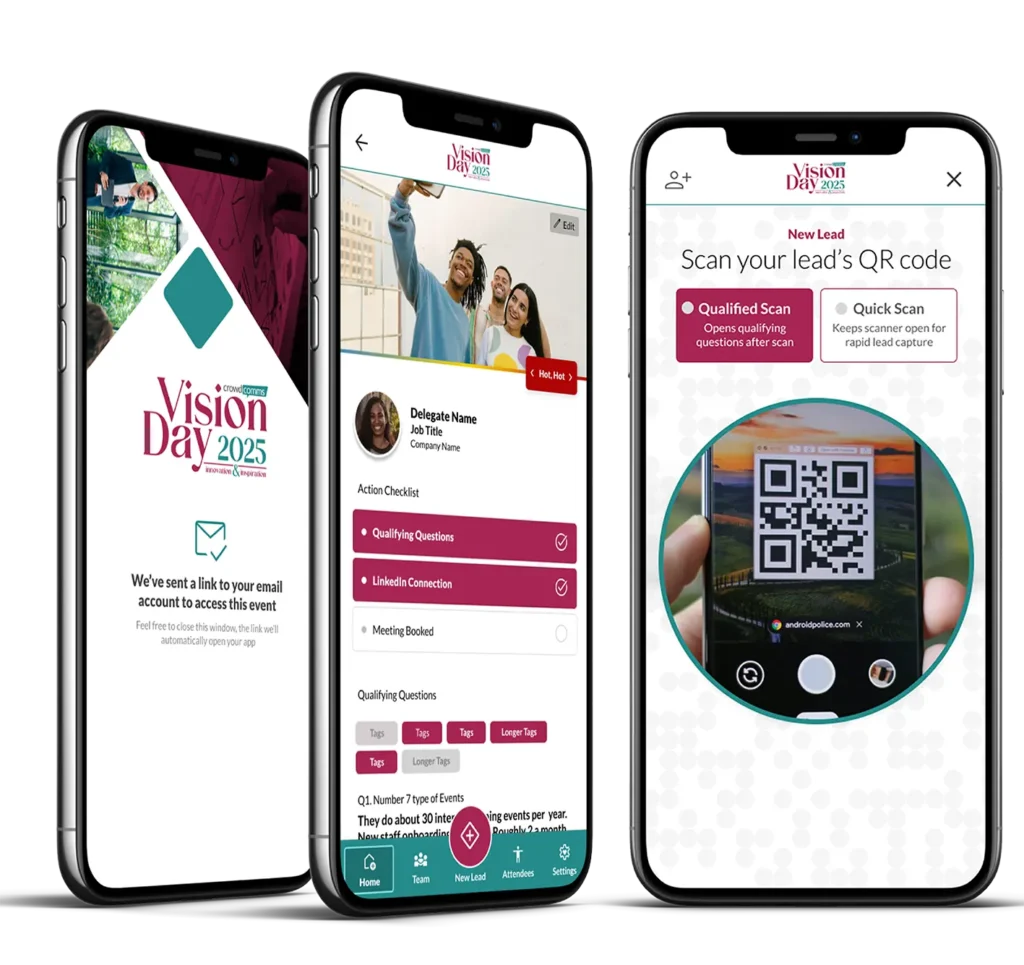
Sponsor ROI reporting in 2026 should include booth traffic, lead capture data with CRM-exportable formats, branded content engagement metrics and individual reports broken out per sponsor. For any event that relies on sponsor or exhibitor revenue, this section of your event ROI report is not optional. It is the section that determines whether those partners renew. The standard for what counts as adequate has risen sharply.
A PDF with logo placement statistics and a thank-you note is no longer enough. Event planners and PCOs who retain sponsor investment year on year treat the sponsor report as a deliverable with the same rigour as any other client output. Break out individual reports for each sponsor or exhibitor rather than presenting aggregate figures. A headline sponsor and a first-time exhibitor have very different benchmarks for success.
“Sponsors who can’t see their return won’t renew. The events that retain sponsor investment year on year are the ones that treat the sponsor report as a deliverable, not an afterthought.”
WHAT SPONSOR REPORTS SHOULD INCLUDE
Booth and branded session traffic: total visits and dwell time where available
Lead capture data: quantity, job titles, company names and any qualification questions answered
Branded content engagement: views, clicks and interactions with in-app sponsor placements
Share of impressions: how their brand performed relative to overall event reach
Exportable lead data in a format that uploads directly into a CRM
Event platforms that include native lead capture and exhibitor analytics make this section considerably easier to produce. When all the data lives in one place and can be filtered by sponsor, the time required to build sponsor reports drops from days to hours.
How do you track pipeline and business impact from an event?
To track pipeline and business impact from an event, connect your attendee data with CRM records after the event and monitor account progression in the 60–90 days that follow. For corporate events and agency-run B2B events, pipeline influence is the metric that gets boardroom attention. It is also the one most event teams avoid because it requires cross-functional coordination. That avoidance is a missed opportunity.
Pipeline influence does not need to be exact to be persuasive. Identifying that three of your top ten target accounts attended and two progressed to proposal stage within 90 days adds business context that no engagement figure can match. The key is to involve the sales or account management team before the event, not just at reporting time, so that relevant contacts are flagged in the CRM ahead of the event date.
For internal events such as leadership conferences, team away days or training programmes, pipeline influence is replaced by other business impact metrics. Employee engagement scores measured before and after the event, training completion rates, internal NPS and measurable changes in output are all valid alternatives. The principle is identical: show that the event moved the needle on something that matters to the organisation, and quantify the movement as precisely as the data allows.
How do you calculate event ROI?
The standard formula for calculating event ROI is: (Revenue or Value Generated − Event Costs) ÷ Event Costs × 100 = ROI %. However, because the value generated by an event is rarely purely financial, the most useful approach is to calculate ROI differently by event type rather than forcing all events into the same formula.
For events where “revenue generated” is not a direct figure, such as internal conferences, member meetings or thought leadership events: replace revenue with a measurable proxy for value: pipeline influenced, employee engagement score improvement, CPD completions or sponsorship renewal rate. What matters is that the value figure is defensible and tied to a business objective that was set before the event took place.
HOW TO APPROACH ROI BY EVENT TYPE
- Association conferences: Revenue = ticket sales + sponsor + exhibitor fees. Value add = membership renewals influenced, CPD completions, new member acquisitions.
- Corporate internal events: Revenue = pipeline influenced + deals closed. Value add = engagement scores, training completion rates, internal NPS.
- Agency-run client events: Revenue = client contract retained or upsold. Value add = measurable improvement in client KPIs versus previous edition.
- PCO-managed conferences: Revenue = delegate fees + sponsorship + exhibition income. Value add = satisfaction scores, rebooking rates, sponsor renewal commitments.
Do not become too focused on arriving at a single ROI percentage. The calculation is useful as a headline figure for executive summaries, but the more important goal is demonstrating that the event delivered against its stated objectives. A well-run event with modest quantifiable ROI but strong qualitative evidence of impact often tells a more compelling story than a high-revenue event with poor engagement data.
What structure should a post-event report follow?
A post-event report should open with a one-page executive summary, followed by attendance and reach data, engagement highlights, sponsor performance, pipeline impact, a benchmark comparison and recommendations for the next event. The order matters as much as the content, because most stakeholders will skim before reading in depth, so front-loading the most important information is not optional.
- Executive summary: one page, three to five key numbers, one sentence on what went well and one on what to improve next time
- Attendance and reach breakdown: registered versus attended, no-show analysis, session-level data, geographic and organisational spread
- Engagement highlights: top sessions, app usage, poll participation, networking activity, survey scores
- Sponsor and exhibitor performance: individual reports for each partner with exportable lead data
- Pipeline or business impact: for B2B events, accounts touched, deals influenced or accelerated
- Benchmark comparison: how this event compares to the previous edition and, where available, industry benchmarks
- Recommendations for next year: specific, actionable suggestions based on the data
The executive summary is the most important section. Many of the people who receive the report, including senior stakeholders, board members and budget holders, will only read the first page. That page needs to answer three questions: did the event succeed, what was the most significant result, and what should be different next time?

When should you be reporting on event data?
Event teams should report in three stages: live during the event, a brief day-after summary, and a full post-event report two to four weeks after the event closes. One of the clearest signs of a mature event team is that they do not wait until the post-event report to share data with stakeholders. Each stage serves a different purpose and a different audience.
Live (during the event)
Real-time dashboards covering registration desk flow, session capacity and app engagement give your team the operational information needed to make decisions on the ground. If a session is oversubscribed, you know in time to open additional space. Live data is not for the post-event report. It is for running a better event in the moment.
Day-after
A brief summary for key stakeholders covering headline attendance, any notable moments and early NPS from live polls. This is not a polished document. It acknowledges the event is over and sets expectations for when the full report will follow.
Two to four weeks post-event
The full report, once all survey responses are in and CRM data has been reconciled. Sponsors are particularly sensitive to reporting timelines. Sending a detailed, personalised sponsor report within five business days of the event close signals professionalism and makes renewal conversations considerably easier to initiate.
What is the difference between a good event ROI report and a great one?
The difference between a good event ROI report and a great one is interpretation, not volume. A good report tells stakeholders what happened. A great one tells them what it means, why it matters and what should happen next. The four elements that separate great reports from good ones are benchmarking, attribution, honest analysis and visual formatting.
WHAT SEPARATES GREAT REPORTS FROM GOOD ONES
- Benchmarking: “Our app engagement rate was 74%” is fine. “74%, up from 61% last year and above the industry average of 58%” is compelling.
- Attribution: Name the sessions, speakers and features that drove the most engagement, not just overall averages.
- Honest analysis: Flag what did not work and why, with a recommendation for next time. This builds credibility far more than a report that only highlights wins.
- Visual formatting: Charts, callout statistics and a clear hierarchy. Leadership teams do not read dense tables. Lead with numbers, support with narrative.
Honesty builds credibility faster than any other element of a report. Event reports that only highlight successes quickly lose the trust of experienced stakeholders who know that no event is perfect. A report that names what did not work, including the session that was poorly attended, the sponsor whose lead quality was low and the registration process that caused friction, and proposes specific solutions is far more credible than one that reads as a marketing exercise.

Your event ROI reporting checklist
Use this checklist before sending your next post-event report to confirm it meets the standard that will move budget conversations, retain sponsors and inform better future events. It applies whether you are an in-house event planner, a PCO managing a client event or a corporate events team reporting to senior leadership.
- Does the executive summary include attendance rate, a key engagement metric and one measure of business impact?
- Are sponsor and exhibitor reports broken out individually, with lead data in an exportable format?
- Have key metrics been compared to the previous edition of this event?
- Is pipeline influence tracked, even anecdotally, for B2B events?
- Does the report flag at least one thing that did not go well, with a recommendation for improvement?
- Is the report visually formatted for a non-events audience, with charts, callout statistics and clear section headings?
- Has a draft been reviewed by someone outside the event team before sending?
- Has it been sent within four weeks of the event closing?
If you can check all eight boxes, you are sending a report with a genuine chance of influencing next year’s budget, retaining sponsor partners and improving the event it describes.
Talk to the team

Frequently Asked Questions
A mobile event app is a mobile or web-based application that supports event attendees with agendas, engagement tools, content, notifications and interaction.
The best event app depends on your goals. For engagement-led events, specialist mobile event apps often outperform all-in-one platforms.
Attendees use event apps that are intuitive, interactive and relevant to their experience. Are event apps dead? Definitely not. Read or watch our 2025 Event Advice on event apps.
Yes, modern event platforms support in-person, hybrid and virtual attendees through mobile and web-based access.
Related Articles:
Event attendance tracking has rapidly evolved from a simple headcount to one of the most