
Solutions

Measure, Learn, Improve

Event data that proves ROI and feeds your next event.

Registration numbers, engagement stats, check-in data, sponsor performance, it's all being captured, across every part of the event. A configurable dashboard, a live registration view, a custom report builder and full CSV export mean building your ROI report is a matter of pulling from a few well-built views, not hunting across five different systems from scratch.

Registration
Engagement
Badging & check-in
Sponsors
Surveys
Your ROI report
Dashboard views Exportable charts Full CSV export

Data You Can Actually Use, Not Just Collect

A straightforward account of what's captured, where you can see it, and how you get it out, not a promise of one all-seeing dashboard, because it isn't one dashboard. It's a few well-built views that cover what teams actually ask for.

A configurable event dashboard A configurable event dashboard
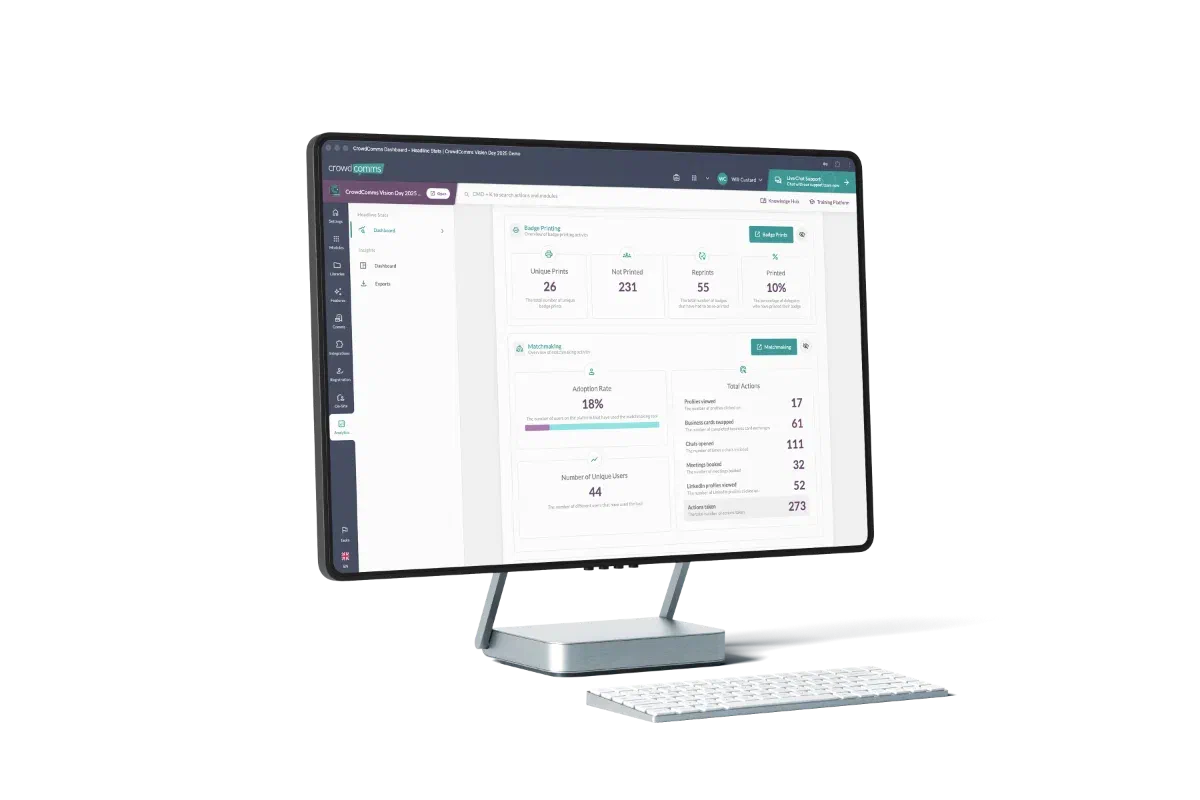
One dashboard for the headline numbers

A Configurable Dashboard Across the Whole Event

Registration, badge printing, session check-in and attendance, meetings and matchmaking, and transactions all surface as headline stats in one configurable dashboard, built around what your team wants to see, not a fixed layout.

See the full Analytics & Insight platform →
A live registration flow dashboard A live registration flow dashboard
Watch registration move in real time

A Live View of the Registration Flow

See attendees move through added, invited, pending, draft and registered in real time, rather than waiting for an end-of-day export to know where things stand.

See the full Event Registration platform →
The report builder with saved views The report builder with saved views
Build the exact view your team needs

A Report Builder, Not Just a Fixed Report

Pick the questions, columns, groupings and response types that matter for a specific job, flight information for the team handling travel, dietary or accommodation detail for whoever's managing logistics, and save it as a quick-link view you can return to with one click, instead of rebuilding the filter every time.

See the full Analytics & Insight platform →
Charts and response insights Charts and response insights
Charts ready for the boardroom

Charts You Can Actually Present

Registration response breakdowns render as charts and graphs in-platform, and export as images, ready to drop straight into a stakeholder deck rather than being rebuilt in another tool first.

See the full Analytics & Insight platform →
Go further with the CrowdComms MCP server

When Our Dashboards Aren't Enough, Build Your Own

Not every question about your event fits a pre-built report. The CrowdComms MCP server connects your event data directly to tools like Claude, so your team can ask a question in plain language, build a custom view around exactly what you need, or go as far as generating entirely new content, without waiting on a new feature request or logging into the CMS. It's OAuth-based, so most MCP-compatible AI tools can connect, not just Claude.

Straightforward, ask a question, get an answer
How many badges have we printed so far, and how many reprints?
1,842 badges printed of 2,110 registered. 37 reprints, 12 in the last hour, all at station 3.Answered live from your event data
Get creative, go further than a single report
Compare engagement across all four events in the series and summarise the mood in Q&A.
Engagement is up 22% on Manchester, driven by Q&A rather than polling. Recurring themes: pricing clarity, session length, and requests for more hands-on workshops.Combined across 4 apps into a narrative summary
Headline feature

The Big One: Pages, Not Just Numbers

The MCP server doesn't just answer questions, it can push content straight into your app using CrowdComms' HTML module. A connected AI can build and inject a fully custom page: a sponsor showcase, a personalised agenda view, a results page, anything you can describe, live in the app, without ever opening the CMS.

Describe the page you want, in plain language
It gets built and injected directly via the HTML module
No CMS login, no dev ticket, no waiting on a build slot
Works from Claude or any other MCP-compatible AI tool
An AI-built page live in the app

With CrowdComms, you don’t fit into our platform; the platform fits you great.

We deliver fully flexible event tech that fits your brand, audience, and goals. From custom event registration to branded apps and agendas, every element is tailored, with zero compromise.

Our event platform integrates with your systems and workflows, so data moves intelligently across your entire event ecosystem.

EDF Energy

“What made the biggest difference was how much admin it took away from the team. Having all the data in one place meant fewer emails, fewer manual checks, and much less room for error.”
View All Testimonials

Book a Demo

What You Can Measure Today

Configurable dashboard, registration, badging, check-in, meetings, transactions
Analytics & Insight
Live registration flow dashboard (added, invited, pending, draft, registered)
Event Registration
Custom report builder with saveable quick-link views
Analytics & Insight
Charts and graphs for registration responses, exportable as images
Analytics & Insight
CSV export across all data
Analytics & Insight
Email open and click rates
Event Registration
Direct data access via the CrowdComms MCP server
Talk to us

Frequently Asked Questions About Event Data

Answers to common questions about event data, measuring success and improving future events.

Yes. The dashboards are configurable, and the CrowdComms MCP server connects your event data to AI tools like Claude, so you can ask questions in plain language and get answers back without waiting on a report.

Yes. The MCP server can generate new content, a sponsor showcase, a personalised agenda view, a fully custom page, and open it live in the app without rebuilding anything.

Yes. All event data exports to CSV, and direct data access through the MCP server lets you pull it into your own reporting or BI tools.

Yes. Dashboards update in real time, so you can watch registration, attendance and engagement as the event runs and act on it on the day.

Yes. Email open and click rates sit alongside the rest of your event data, so you can see which messages landed and adjust the next send.

Save the views and reports that mattered, export the numbers, and carry them into planning, so each event builds on what the last one actually showed rather than guesswork.

Ready to see your event data in one place?

Excellent ★★★★★
Trustpilot · ISO 27001 · SOC 2 · BSI
Book a Demo